Matthias Kraus worked as a doctoral researcher on project A03 at the University of Konstanz. In November 2021 he successfully defended his thesis.
Assessing the Applicability of Virtual Reality for Data Visualization
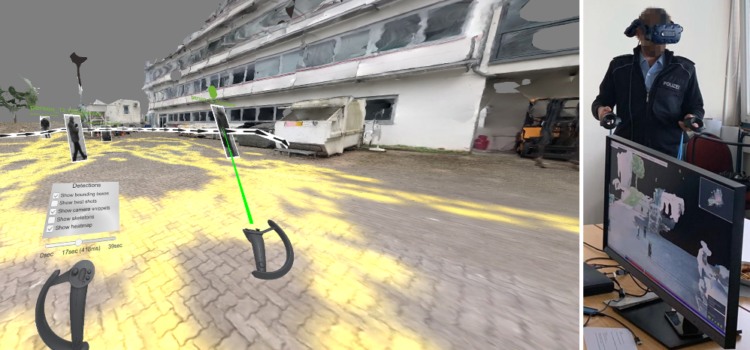


Matthias Kraus worked as a doctoral researcher on project A03 at the University of Konstanz. In November 2021 he successfully defended his thesis.
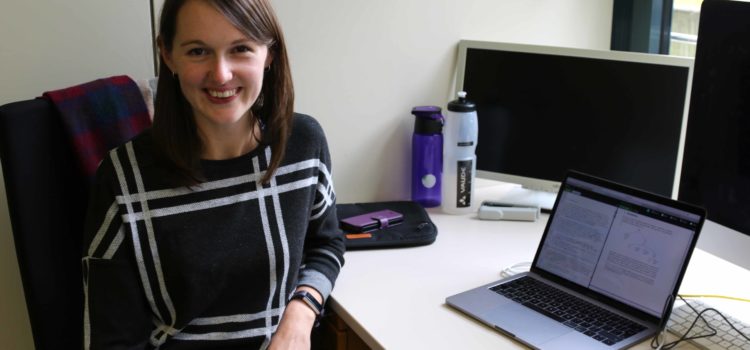
Hannah Booth from UK tells about her intersting research time at Miriam Butt’s project D02.
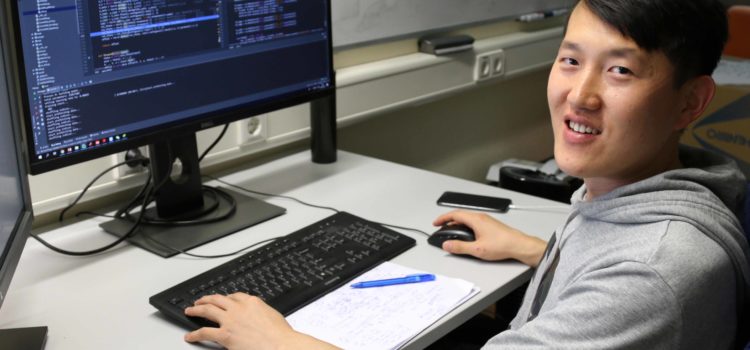
During his 8-month research stay in Konstanz, Xingija Pan worked in the Visual Computing workgroup of Prof. Oliver Deussen.
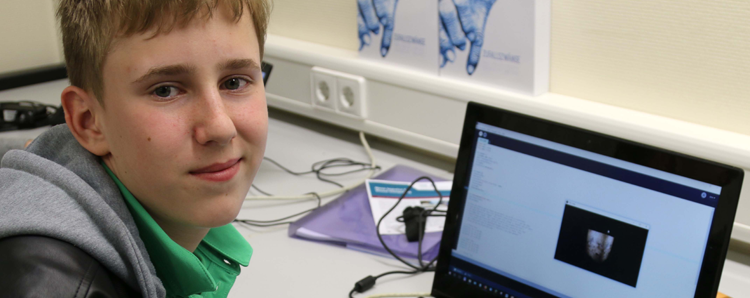
Ich bin Tim, 15 Jahre alt und wohne in Heidenheim, gehe zur Schule allerdings aufs Internat in Schwäbisch Gmünd. Jeder Schüler in Baden-Württemberg muss in der 10. Klasse ein Praktikum absolvieren, welches als BOGY-Praktikum bekannt ist. So auch ich. Insgesamt kann ich sagen, dass die BOGY-Woche für mich eine wunderschöne Zeit war und ich einen richtig guten Einblick in den Berufsalltag von Informatikern bekommen habe.
The SIGGRAPH Asia 2017 conference was held in Bangkok. It attracted many interested visitors from industry, education and other fields. The conference is mainly about rendering, graphics and animation. However, there is also a small Symposium on Visualization (SA17VIS) for researches from visualization and more graphics intensive backgrounds to meet and exchange ideas. During this symposium we had the change to present our paper “Visual Exploration of Mainframe Workloads”.
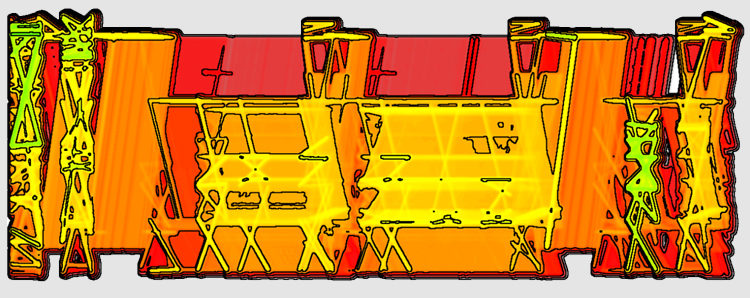
Many applications exist that deal with relations, between people in a social network, between functions in a software system, or between cities in a transportation network. Typically, such relations are not static, but they are changing more or less frequently over time. This means the social contacts of people may differ from time to time, the function calls may change if new components are implemented, or routes may be blocked due to traffic jams or bad weather conditions.

I had the chance to interview Prof. Grinstein after his talk ‘Visual Analytics: A Modern View of its Future and Research Opportunities’ at the University of Konstanz in June 2017, when he visited Prof. Daniel A. Keim and his project team within the SFB-TRR 161. In my interview he was answering questions like “Why is research in the field of computer science, data visualization and visual analytics so important?”, “What are the major risks of visualization and visual analytics in the future?”, “What do we have to teach our children to make them fit for the future world?”, or “What challenges does Georges Grinstein still have?”
Every year in autumn, researchers and practitioners from academia, government, and industry come together at IEEE VIS to explore their shared interests in tools, techniques, and technology. Among them, there was also a group of visual computing researchers from the Universities of Stuttgart and Konstanz. They visited this scientific meeting to present their newest insights and developments in the field of Visual Computing. In this blog post you find a list of the their publications presented to the international community.
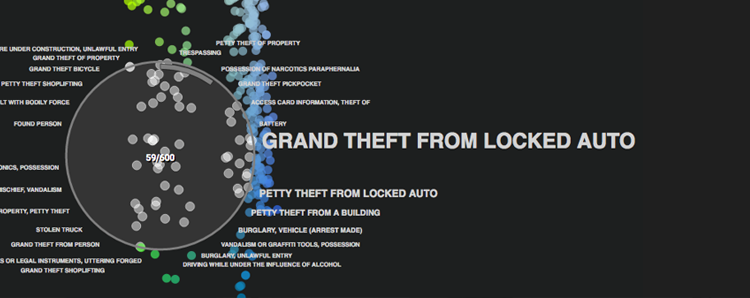
Visualizations represent a means to communicate data and analysis results. Our research at the Chair for Data Analysis and Visualization is driven by real-world problems and intends to bring the human capabilities and perception together with computer algorithms, using visualization. Thereby, we face the key challenge of how to visually communicate data to the human. A common assumption of visualization researchers is: the more abstract a representation is, the harder it is to interpret for the human, in particular if not trained in reading visualizations.

This summer, I spent three months at the Ilab at the University of Calgary. My supervisor Sheelagh Carpendale is head of the InnoVis group which is part of the Ilab. I had the opportunity to visit the Ilab through the MIN Program: Mentoring International for Female Natural Scientists at the University Konstanz and which was funded by the Transregional Collaborative Research Center (SFR-TRR) 161. During my time, I worked with five great researchers evaluating a website developed and designed by them.