Jochen Görtler from SFB-TRR 161’s project A01 successfully defended his Ph.D. thesis – Quantitative Methods for Uncertainty Visualization.
Quantitative Methods for Uncertainty Visualization
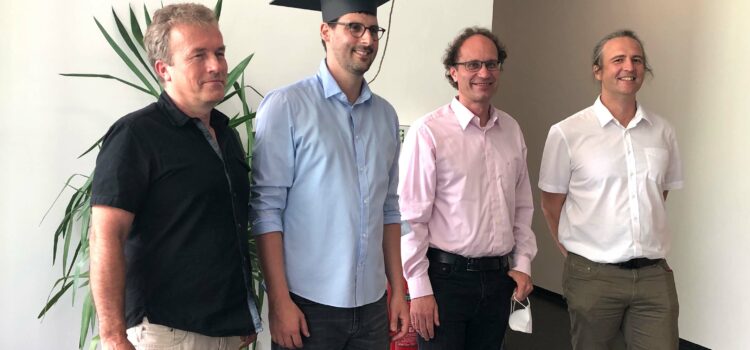


Jochen Görtler from SFB-TRR 161’s project A01 successfully defended his Ph.D. thesis – Quantitative Methods for Uncertainty Visualization.
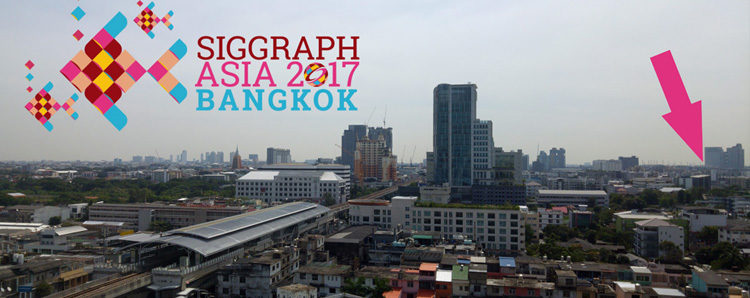
The SIGGRAPH Asia 2017 conference was held in Bangkok. It attracted many interested visitors from industry, education and other fields. The conference is mainly about rendering, graphics and animation. However, there is also a small Symposium on Visualization (SA17VIS) for researches from visualization and more graphics intensive backgrounds to meet and exchange ideas. During this symposium we had the change to present our paper “Visual Exploration of Mainframe Workloads”.
Every year in autumn, researchers and practitioners from academia, government, and industry come together at IEEE VIS to explore their shared interests in tools, techniques, and technology. Among them, there was also a group of visual computing researchers from the Universities of Stuttgart and Konstanz. They visited this scientific meeting to present their newest insights and developments in the field of Visual Computing. In this blog post you find a list of the their publications presented to the international community.
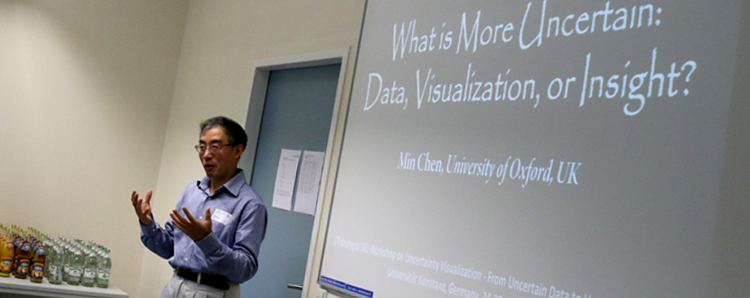
In July 2017 I joined the workshop Uncertainty Visualization – From Uncertain Data to Uncertainty Theory at the University of Konstanz. The aim of the workshop was to discuss the possibility to quantify the extend of perceived uncertainty transported by a visualisation.
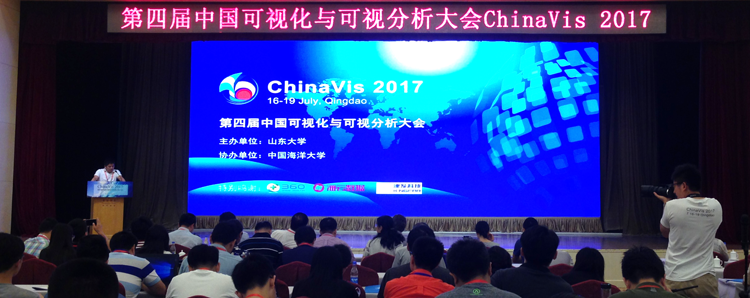
The ChinaVis 2017 conference took place Qingdao from July 17th till July 19th and was hosted in the coastal city of Qingdao in the Shandong Provence. On July 16th, one day prior to the conference the China-Germany Visualization Workshop took place. The purpose of this workshop is to foster the collaboration between research groups in this field from China and Germany.