Every year in autumn, researchers and practitioners from academia, government, and industry come together at IEEE VIS to explore their shared interests in tools, techniques, and technology. This year’s IEEE VIS 2017 is currently running in Phoenix, Arizona USA. Last Sunday the full-packed program started with more than 1,000 participants from all over the world that want to listen to research presentations, tutorials, and workshops, or take part in demonstrations, posters sessions, and exhibitions. Among them, there was also a group of visual computing researchers from the Universities of Stuttgart and Konstanz. They visited this scientific meeting to present their newest insights and developments in the field of Visual Computing. In this blog post you find a list of the their publications presented to the international community.
How to analyze sport?
Two talks had been about sport analysis. The project “Bring it to the Pitch: Combining Video and Movement Data to Enhance Team Sport Analysis” was shown by a group from the University of Konstanz. This is a visual analysis solution, that allows to analyze team sport behaviour based on video and movement data. Among others, this development shows the player movements, pass alternatives, interaction of the players, and free spaces (Watch a preview of the talk on Vimeo). Another publication with similar background was “Director’s Cut: Analysis and Annotation of Soccer Matches“. It is about the analysis and annotation of soccer matches (Watch a preview of the talk on Vimeo)
Nonlinear Dot Plots, Pattern Trails, Uncertainty Visualization, and SOMFlow
Besides, Nils Rodrigues and Daniel Weiskopf presented Nonlinear Dot Plots – a new type of diagram that shows the distribution of data. This diagram type is able to visualize countable data samples for data sets with a large range of frequencies, and to visualize data distributions with well above a thousand individual values.
Dominik Jäckle, Michael Hund, Michael Behrisch, Daniel A. Keim, and Tobias Schreck published Pattern Trails: Visual Analysis of Pattern Transitions in Subspaces. They presented this VAST paper during the track “High-dimensional Data” at Wednesday.
A new information visualization method named Bubble Treemaps for Uncertainty Visualization – a collaborative work by Jochen Görtler and Oliver Deussen from Konstanz, and Christoph Schulz and Daniel Weiskopf from Stuttgart – was discussed yesterday during the “Trees and Table Tennis” session. For those, who didn’t had the chance to listen to this talk, and those, who want to get further information just visit the open source platform github on https://github.com/grtlr/bubble-treemaps. There you find the paper, as well as the code, and a demo.
And last but not least, the talk by Dominik Sascha from Konstanz during the Cluster Analysis track yesterday in the afternoon, presented the VAST papers SOMFlow: Guided Exploratory Cluster Analysis with Self-Organizing Maps and Analytic Provenance.
Below you can find the preview films for the mentioned papers:
- Nonlinear Dot Plots (Vimeo)
- Pattern Trails: Visual Analysis of Pattern Transitions in Subspaces (Vimeo)
- Bubble Treemaps for Uncertainty Visualization (Vimeo)
- SOMFlow: Guided Exploratory Cluster Analysis with Self-Organizing Maps and Analytic Provenance (Vimeo)
Contribution to the Arts Program VISAP
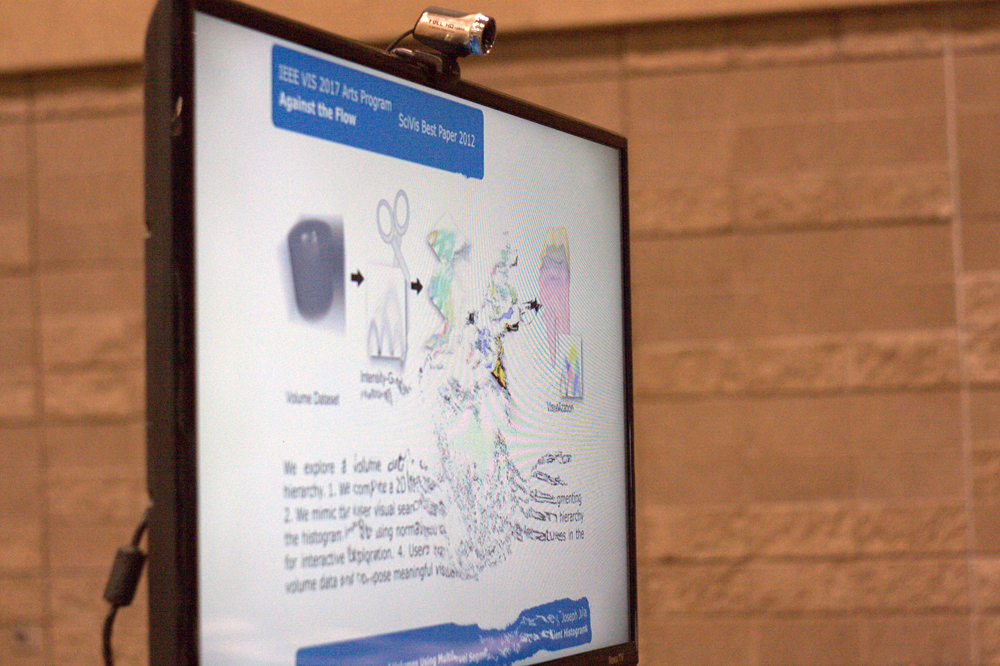
A further key issue of the IEEE VIS is the art program VISAP. This event shows innovative artwork and research that explores the exciting and increasingly prominent intersections between art, design, and visualization. This year, the SFB-TRR 161 researchers Kuno Kurzhals and Daniel Weiskopf took part in this channel with their contribution “Against the Flow”.
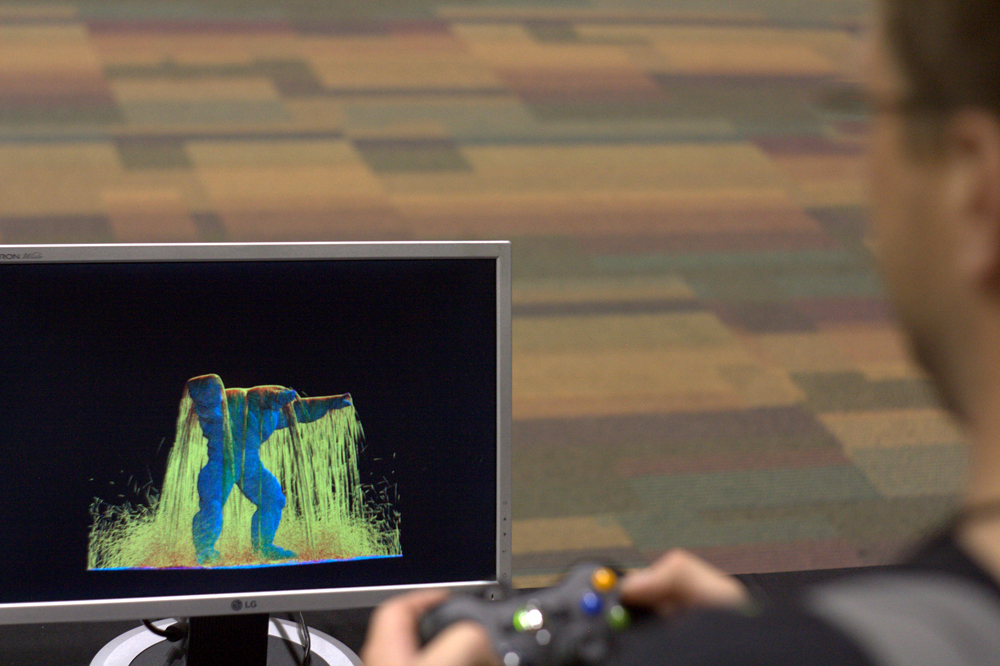
Another project developed by visualization experts from the University of Stuttgart was named “Particle Flow Fireworx“. In this solution, Stefan Reinhardt and Markus Huber showed animated flow visualizations of particle based fluid simulations. This artwork emphasizes the aesthetics of dynamically changing shapes of liquids.