Doctoral researcher Christoph Schulz spent three months at the ETH Zurich working on order-statistical measurements for graphs and networks to assess representativeness.
My Research Stay at the ETH Zürich
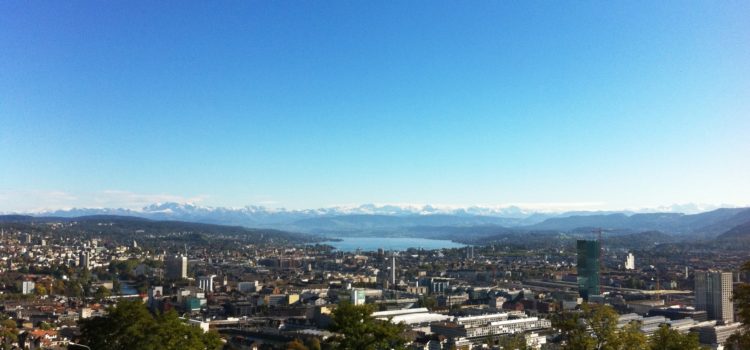


Doctoral researcher Christoph Schulz spent three months at the ETH Zurich working on order-statistical measurements for graphs and networks to assess representativeness.
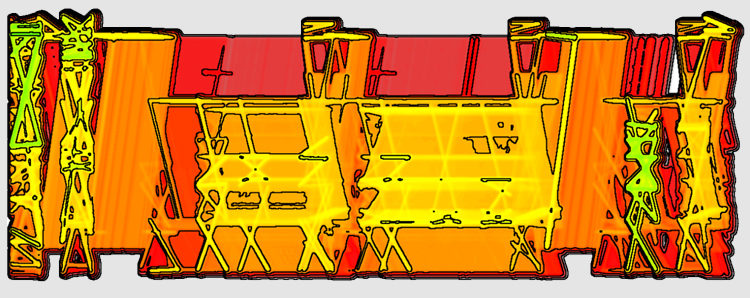
Many applications exist that deal with relations, between people in a social network, between functions in a software system, or between cities in a transportation network. Typically, such relations are not static, but they are changing more or less frequently over time. This means the social contacts of people may differ from time to time, the function calls may change if new components are implemented, or routes may be blocked due to traffic jams or bad weather conditions.

This year’s EuroVis, one of the most important visualization conferences in Europe, as well as many co-located events took place in Barcelona, Spain. Despite outside temperatures of well beyond 30°C, the attendees enjoyed many interesting talks on the latest visualization research topics and discussed them with researchers in the field from all over the world.

We are currently running an online study in the field of graph visualization. We hypothesize an optimum in the ratio of node size and edge width in node-link-diagrams. This study is wrapped in two online games, which are based on such node-link-diagrams. Here, we still need more played games. You do not need to have special knowledge about Graph Theory or similar, you only need to operate your mouse.
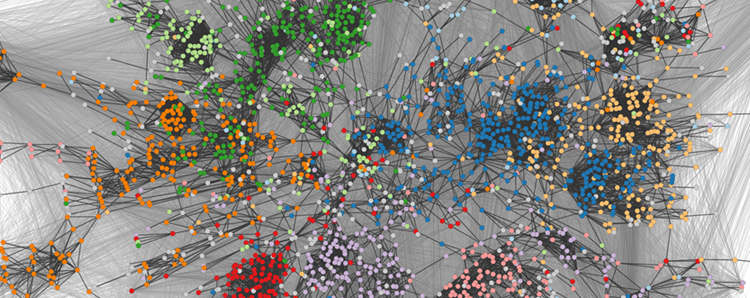
Can you imagine the social connections people had at the beginning of the 20th century? They had their family and a strong connection to neighbors. Most probably friends were living in the same village or in the next town. You could have painted a bubble for each person you knew on one sheet of paper and even would have had room enough to put the name in the middle – a network easy to analyze. One century later we are dealing with huge networks that allow us to model and study many real world phenomena since they are capable of representing pairwise relations between the items of interest. Arlind Nocajs’ graduate thesis “Untangling Networks: Focus on Less to See More” emphasizes certain aspects using various visualization techniques and graph drawing methods.
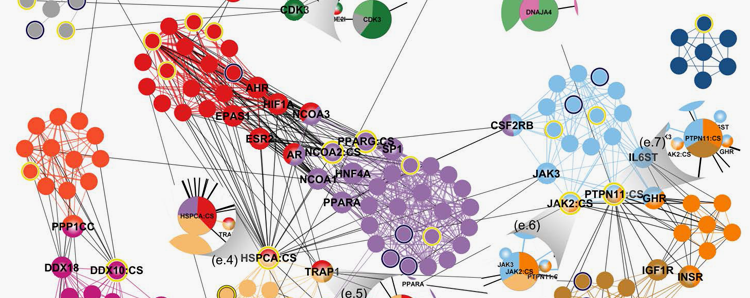
Whenever we want to change things and strive for new visions, we have to understand an existing system in the first place. For that purpose scientists are working on extensive tests and studies, they take measurements and collect statistical data. The more understandable and evident their data collections are, the easier they will gain new findings and subsequently explain their results and ideas to others. With increasing complexity of the data and considering that properties and parameters may change over time, it becomes difficult to analyze the data manually. Visual computing scientists work on new applications and new methods for a better handling of this data using software systems.