Dative Subjects: Historical Change Visualized

Dative Subjects: Historical Change Visualized

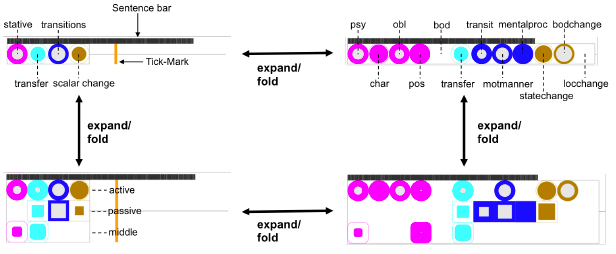
Linguistic data is inherently multidimensional, with complex interactions between
different linguistic features and structures being the norm rather than the
exception. Historical linguistic change typically is the result of such complex interactions.
The core remit of historical linguistic work is to identify a language change
and to understand how different relevant factors have interacted with each other
across time to effectuate the change.

From Ontario to Konstanz – My Three Months Research Stay

From Ontario to Konstanz – My Three Months Research Stay

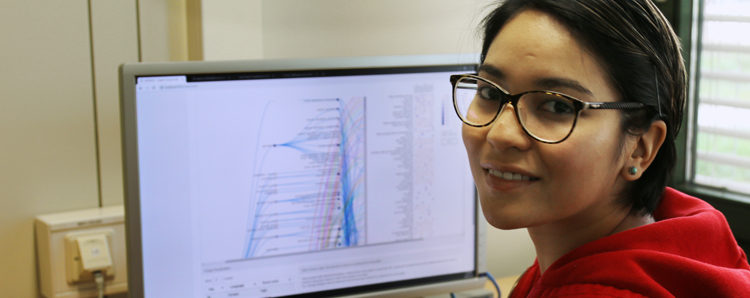
I’m a PhD student at University of Ontario Institute of Technology (UOIT) in Canada, where I belong to the visualization for information analytics laboratory (vialab). In this past summer, I had the amazing opportunity to spend 3 months in the University of Konstanz working closely with the Data Analytics and the Computational Linguistic groups.

Interleaving – A Novel Concept for Visually Scalable Dynamic Graph Visualization

Interleaving – A Novel Concept for Visually Scalable Dynamic Graph Visualization

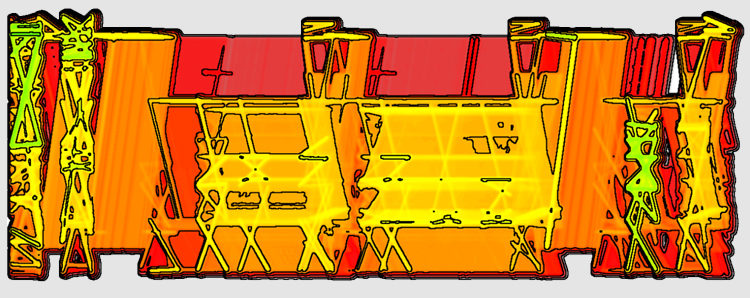
Many applications exist that deal with relations, between people in a social network, between functions in a software system, or between cities in a transportation network. Typically, such relations are not static, but they are changing more or less frequently over time. This means the social contacts of people may differ from time to time, the function calls may change if new components are implemented, or routes may be blocked due to traffic jams or bad weather conditions.

Prof. Georges Grinstein – Why is his research so important and what does he tell his grandchildren?

Prof. Georges Grinstein – Why is his research so important and what does he tell his grandchildren?

I had the chance to interview Prof. Grinstein after his talk ‘Visual Analytics: A Modern View of its Future and Research Opportunities’ at the University of Konstanz in June 2017, when he visited Prof. Daniel A. Keim and his project team within the SFB-TRR 161. In my interview he was answering questions like “Why is research in the field of computer science, data visualization and visual analytics so important?”, “What are the major risks of visualization and visual analytics in the future?”, “What do we have to teach our children to make them fit for the future world?”, or “What challenges does Georges Grinstein still have?”

Abstract Data Visualization: A Qualitative Study with Intelligence Data Analysts

Abstract Data Visualization: A Qualitative Study with Intelligence Data Analysts

Visualizations represent a means to communicate data and analysis results. Our research at the Chair for Data Analysis and Visualization is driven by real-world problems and intends to bring the human capabilities and perception together with computer algorithms, using visualization. Thereby, we face the key challenge of how to visually communicate data to the human. A common assumption of visualization researchers is: the more abstract a representation is, the harder it is to interpret for the human, in particular if not trained in reading visualizations.

Cookie Consent with Real Cookie Banner