
This year’s EuroVis, one of the most important visualization conferences in Europe, as well as many co-located events took place in Barcelona, Spain. Despite outside temperatures of well beyond 30°C, the attendees enjoyed many interesting talks on the latest visualization research topics and discussed them with researchers in the field from all over the world.
Keynote Presentations focusing Visualization Research
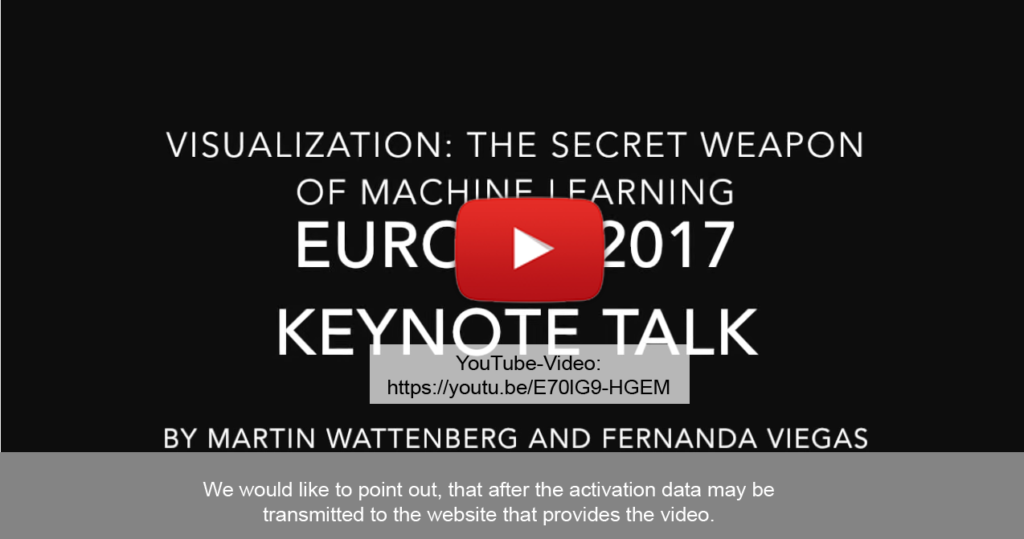
Besides presentations of papers, state of the art reports, posters and industrial talks, a keynote and a capstone presentation were given as a frame of the conference. Martin Wattenberg and Fernanda Viégas (both from Google) gave the keynote presentation that focused on how visualization can help in understanding machine learning. They showed and discussed different recent work on interactive exploration for helping people use, interpret, and learn about machine learning.
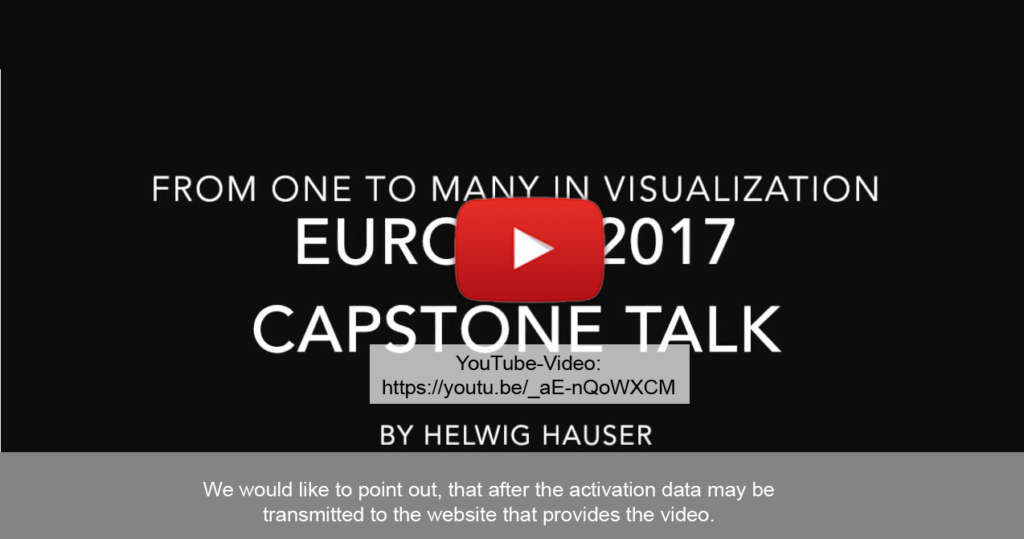
Helwig Hauser from University of Bergen gave an inspiring capstone talk on how the transition from visualization of individual datasets to visually analyzing large sets of datasets could be a chance for radical innovation in the field of visualization. He brought up some challenging research questions, e.g., on how to study hundreds of thousands of data sets simultaneously.
Contributions from Stuttgart
Several members of the University of Stuttgart and the SFB-TRR 161 contributed in various ways to the conference. At the co-located EGPGV, Gleb Tkachev presented our research on Prediction of Distributed Volume Visualization Performance to Support Render Hardware Acquisition. For this work, we use neural networks to learn and predict volume raycasting performance, which can be used to aid in decisions regarding cluster hardware procurement. Moritz Heinemann, a master student at the University of Stuttgart, had the chance to present our work on Power Efficiency of Volume Raycasting on Mobile Devices at the poster session. In this work, which resulted from a student project, the impact of different parameter configurations and programming APIs on power consumption during rendering of volume data sets on mobile devices were investigated.
Marcel Hlawatch presented his technique on Visualizing a Sequence of Thousand Graphs (Or Even More) in a single image. Dynamic graph data is represented as a series of bipartite graphs that can be overlayed with a small offset, thereby generating a compact representation of the whole graph sequence. Tanja Blaschek presented her research on Visual Comparison of Eye Movement Patterns, a graph comparison method using radial graphs that show areas of interest and their transition. The method can be used when analyzing eye movement data to help in understanding task solving strategies and obstacles.
Next year, the EuroVis conference will be hosted in Brno, Czech Republic.