
How did the formation of our landscape develop? Where did existing dolines and terraces arise? And why are there special valley configurations, meander or further landscape shapes, for example dunes directly in Baden-Württemberg? These are only some of the questions geology scientists like Prof. Hartmut Seyfried and his research assistant Elena Beckenbach (Institute of Planetology, University of Stuttgart) try to answer in their research work. Recently they presented their newest results based on a new visualization of the landscape of Baden-Württemberg to an audience mainly composed of members of the Department for Geoinformation and Land Development (LGL) at the Powerwall of the Visualization Research Center of the University of Stuttgart (VISUS).
Resolution of one Meter per Pixel
The research work of geological phenomena requires more than field studies. The experts collect measurement data, study literature and run complex calculations. For an effective analysis they usually have to convert their collected information into visual representations. Commercial software only provides solutions for limited data sets resulting in shaded or colour-coded relief images.
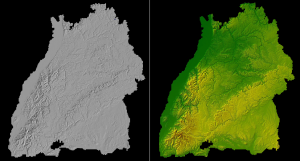
Prof. Seyfried and Elena Beckenbach use landscape data provided by the LGL for their research activities. This data set has a file size of 1 terabyte and contains the territory of Baden-Württemberg with a resolution of one meter horizontally and 15 centimeter vertically. For the visual analysis of this data Dr. Thomas Müller developed a visualization software named TerrainView which can represent the huge data set without time delay at high resolution. The resulting images enable the investigation of landscape details from different perspectives and, due to the high resolution, very precisely. “Things that we could see only roughly before are visible now in a resolution of one meter per pixel”, says Prof. Seyfried.
Landscape Structures Become Visible
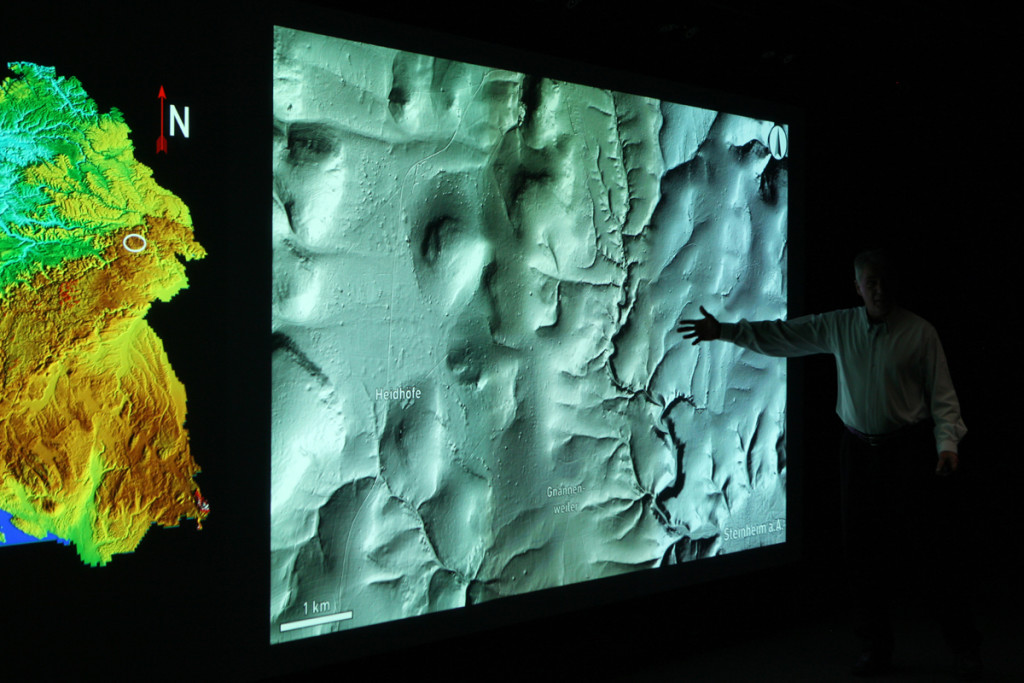
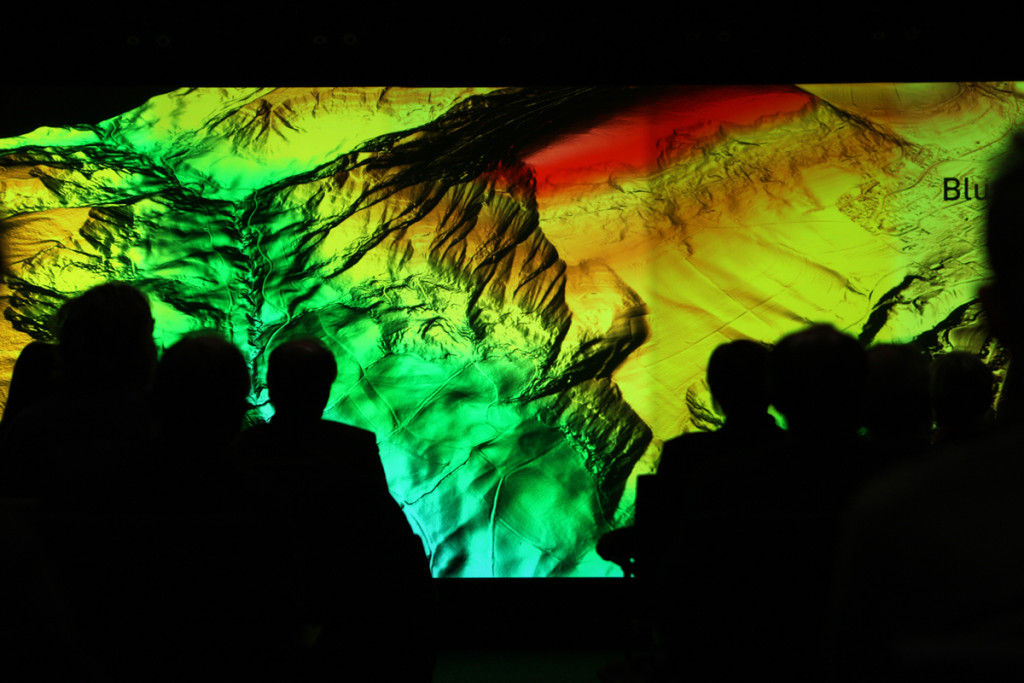
The visualizations make scientifically interesting structures visible. Thereupon the geologists could identify valleys that were created by ice bulks of the Rhein-Glacier during the late Pleistocene as well as those formed by melting water. Also structures of the Wutach Canyon in the Black Forest which are still in a process of sliding, or the so called drift lines of Lake Constance which are not higher than two meters are observable. “Many details of our landscape are only visible visible in the digital terrain model”, emphasizes Elena Beckenbach during her talk. “In some cases you discover something new at first in digital images and then you go to field to make the appropriate ground checks.”
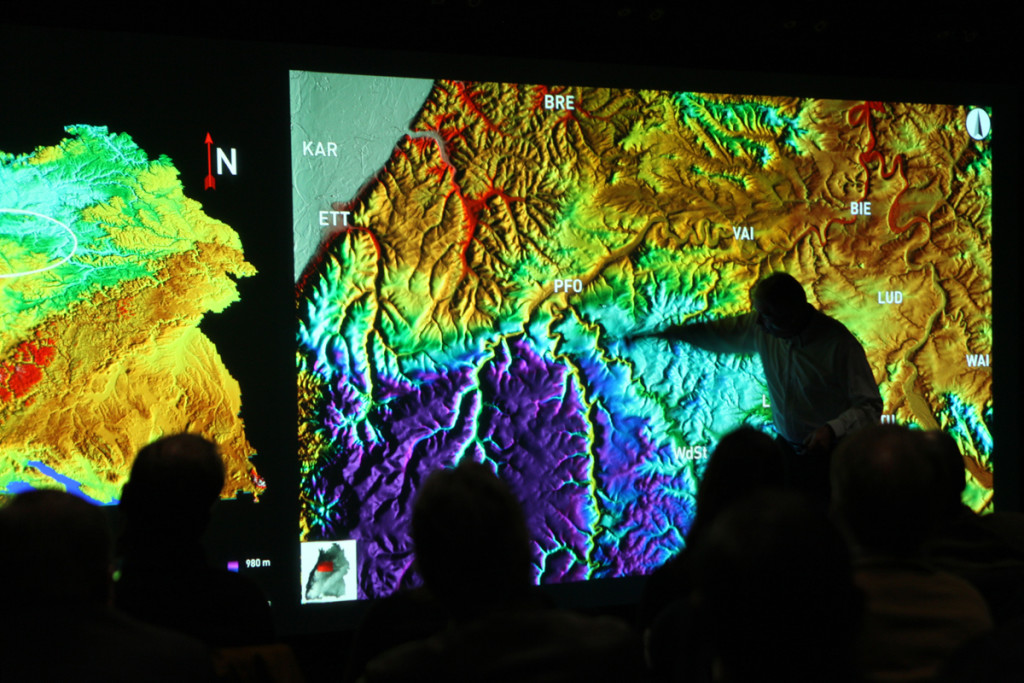
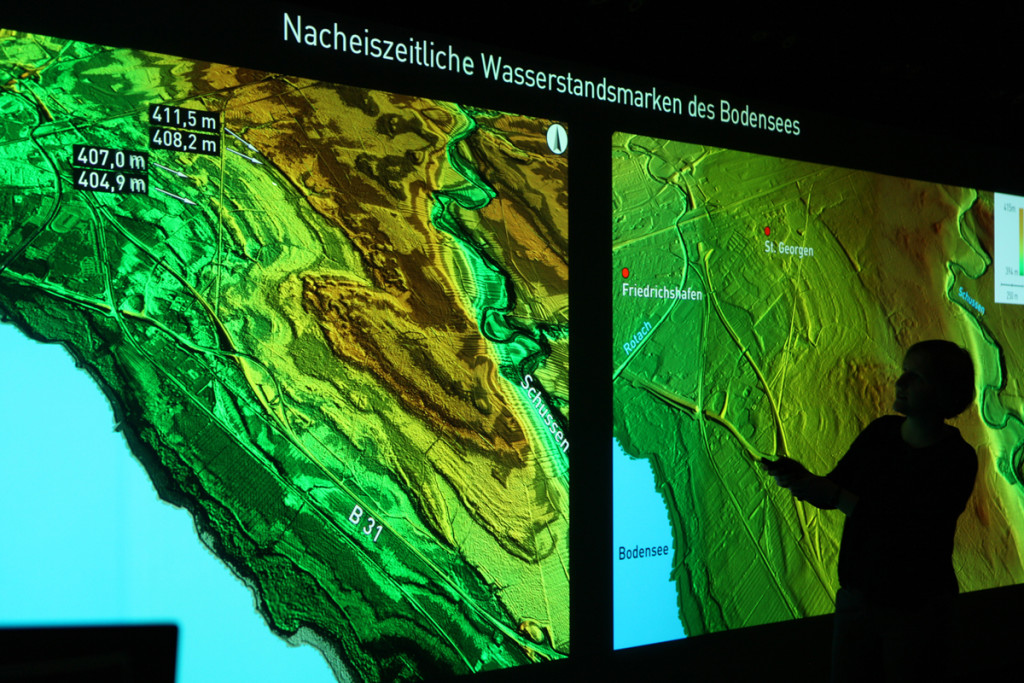
It is the great strength of the VISUS-Powerwall to offer a platform to analyze data of that size and complexity. Researchers of VISUS had to develop a special implementation to bring the virtual images on that six meters wide and about two meters high seamless display. Here the landscape of Baden Württemberg can be viewed in high quality and the geologists can navigate to smallest structures.
Further information about the high resolution model and about TerrainView are available on
http://go.visus.uni-stuttgart.de/terrainview and
http://go.visus.uni-stuttgart.de/glacial_geomorph