
I am thankful for the opportunity to visit Utrecht University (Netherlands) as part of the Integrated Research Training Group of the SFB-TRR 161 for a research stay from February 20 – May 20, 2023. As a doctoral researcher of project A03 of the SFB-TRR 161, I am researching “Quantification of Visual Explainability.” Tackling this larger research area, we aim to explain the outcomes of dimensionality reduction methods using quantitative methods. The quantification of patterns contained in high-dimensional datasets using dimensionality reduction methods would allow us to determine limitations of existing methods, improve them or devise new techniques. In this article I report on my experiences during my research stay at Utrecht University.
During this time, I joined the Visualization and Graphics (VIG) group at Utrecht University, which is led by Prof. Dr. Alexandru C. Talea. The VIG explores and provides visual analysis tools and methods to help scientists and researchers better process and understand large, multi-dimensional, and relational data sets in various domains such as neuroscience, genomics, software engineering, astronomy, and medicine. I chose this group since the goals above and interests overlap with the Visualization and Data Analysis Group of Daniel A. Keim, who is project leader of A03. I contacted Prof. Dr. Michael Behrisch, an assistant professor at the VIG group and alumni of the SFB-TRR 161. Together, we arranged a research stay for three months.
The VIG group is located in the Buys Ballotgebouw at the campus’ Science Park. On Wednesday, there was a group meeting where a large part of the group was present. In this meeting, current organizational topics were discussed. Additionally, there were insightful presentations, usually by Bachelor, Master, or PhD students. I found these presentations inspiring and informative since they facilitated broad exposure to topics in visual data analysis. Early in the research stay, I had the opportunity to present my own work, which led to an exciting discussion about high-dimensional data analysis using categorical data, such as classification results. The ideas proposed by Prof. Talea were invaluable and remain the basis for current and future collaborations. I also had many discussions and brainstormed about topics with other members of the group, where we found relevant and significant overlap. Furthermore, I was invited to participate in social activities outside working hours, including bouldering and a trip to the Keukenhof, a famous flower garden.
We are currently collaborating for a paper focusing on a circular projection method leveraging the difference between dimensionality reduction methods for Euclidean space and spaces with a spherical topology. We plan to submit this paper to EuroVis 2024 with coauthors from both research groups. We are further planning to collaborate on the quantification of quality for other projection methods in the future. However, concrete ideas are still in the formation stage. During my stay, I was able to finish the paper “FS/DS: A Theoretical Framework for the Dual Analysis of Feature Space and Data Space“, where we describe a theoretical framework for the joint analysis of data items and data dimensions combining previously disjoint approaches for dual analysis into one coherent framework. This work is now published in the IEEE Transactions on Visualization and Computer Graphics (TVCG) journal.
Image: Frederik Dennig
Image: Frederik Dennig
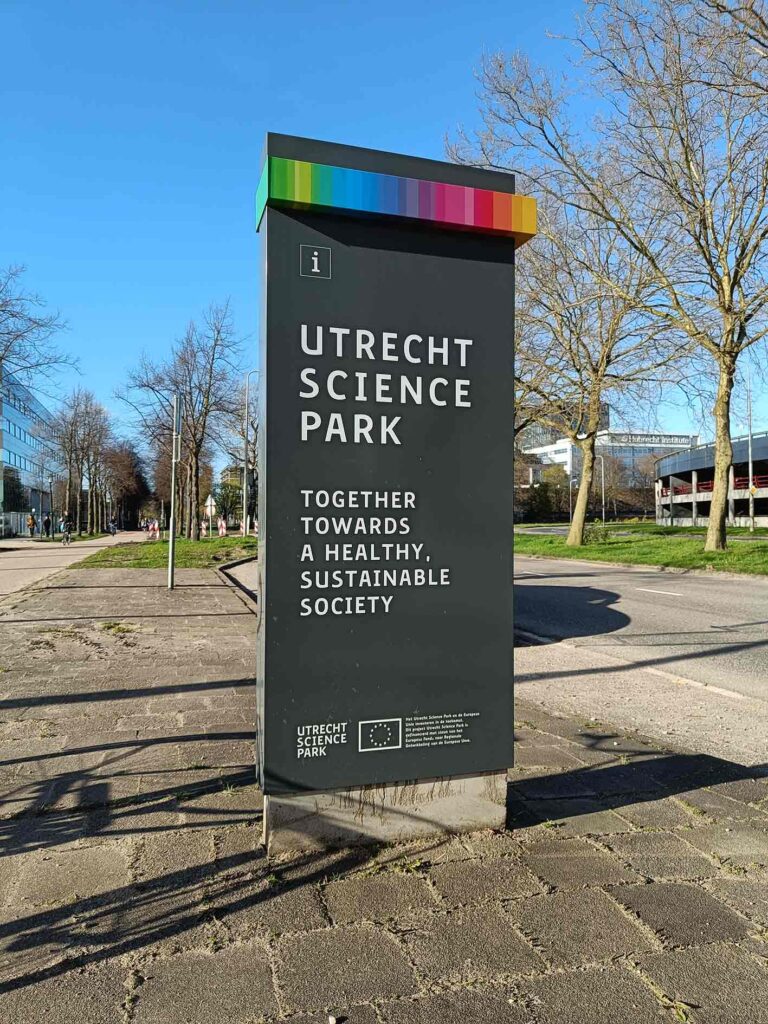
Image: Frederik Dennig