
This years conference on visualization EuroVis 2018 took place from 4th June till 8th June. One objective of this conference is to foster greater exchange between visualization researchers and practitioners and includes a broad scope of visualization areas. EuroVis has been a Eurographics and IEEE co-supported international visualization symposium held in Europe annually since 1999 and has been a conference since 2012.
This year, it was hosted by the Masaryk University in Brno, Czech Republic. Besides the excellent works presented at the conference, there were lots of possibilities to discuss topics with people from diverse areas and to meet new people from various domains worth exchanging experiences.
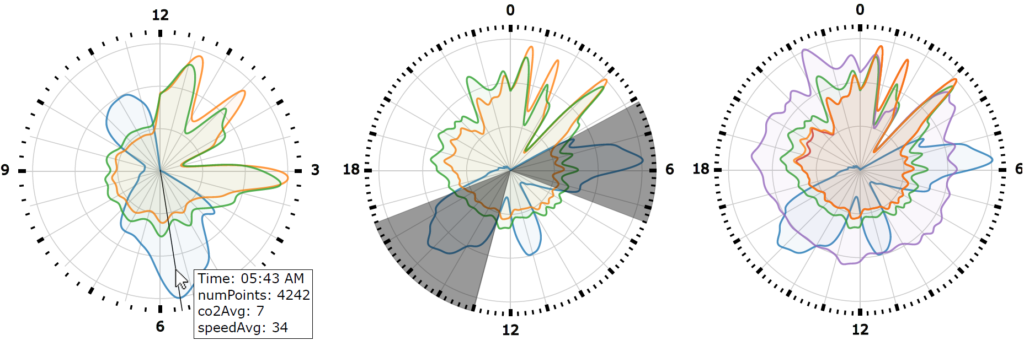
In the course of a co-located workshop EuroGraphics Workshop on Visualization in Environmental Sciences (EnvirVis) we presented our work on Visual Analysis of Urban Traffic Data based on High-Resolution and High-Dimensional Environmental Sensor Data.
Undoubtedly, EuroVis 2018 was a fully successful event. We are looking forward to EuroVis 2019.
Reference:
J. Häußler, M. Stein, D. Seebacher, H. Janetzko, T. Schreck and D. A. Keim. Visual Analysis of Urban Traffic Data based on High-Resolution and High-Dimensional Environmental Sensor Data. Workshop on Visualisation in Environmental Sciences (EnvirVis), The Eurographics Association, DOI: 10.2312/envirvis.20181138, 2018.