
Maps for public transport as busses, subways or trains are part of our daily live. It is self-evident for most of us to read them and we expect them to be designed in a way that we can plan our journeys easily. But who cares about the usability and the design? And how can we be guaranteed that the map design invokes an accurate action by the passengers? Design experts and visualization researchers are working closely together to produce readable and effective map designs.
How metro maps are designed?
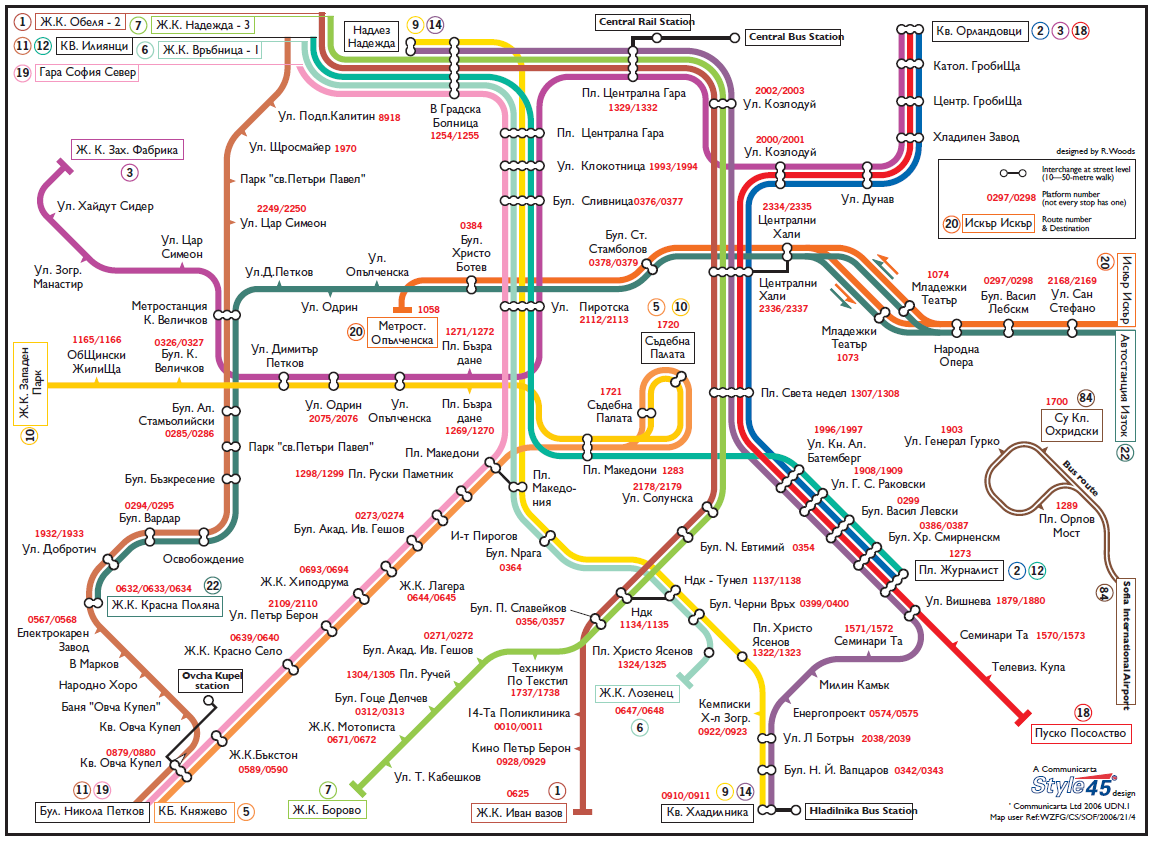
Robin Woods – a designer from Southampton – is working in this field. He creates metro maps, for example for tourist guidebooks. Before he starts his work on his computer, he has to do initial fieldwork. He walks along the routes of public transport taking photos of all stations, then he draws the geaographic layout of the lines on a city map, i.e., he first creates a mark-up. After that very time-consuming task he can finally digitalize his drawings and abstract the geographic lines lines in to 45º angled lines manually.
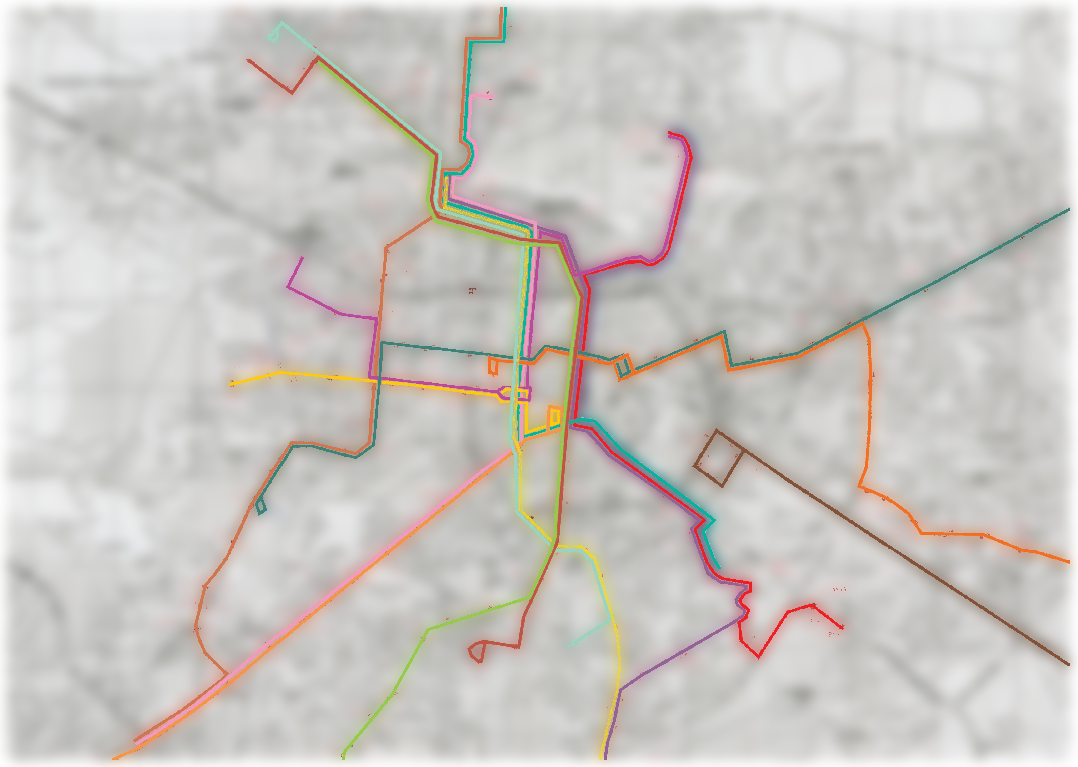
In the early days there was no technical aid like digital cameras for recording tram and bus stop names. The arrival of digital cameras, at prices making ownership a reasonable proposition, was certainly a boon. It has made fieldwork so much easier, particularly where the Latin alphabet is not used in signage, in Athens, Belgrade, Sofia, and St Petersburg, for example. Robin Woods owns libraries with more than 48,000 photos of every single station or stop name on every line in every city Communicarta covers, together with an assortment of other interesting subjects, objects, artefacts, and oddities.
Metro map designers face many challenges, not least of which is how to represent the physical world in as true a form as possible. Leaving aside the long-standing debate about schematics, one of the challenges is the requirement to provide maps to customers in the travel and publishing industry where page size is everything. Here, schematic maps work very well indeed.
Visualization research
From the perspective of a visualizer, metro maps can be regarded as a particular version of information visualization. To achieve the goal of readable and effective map designs we want to combine the expertise of designers like Robin Woods with our own as visualization scientists. Through this we expect synergy effects from which both can benefit. To understand the difficulties that spectators and users of such maps have, the visualization expert can conduct user studies. In such a study the participants have to answer a given task like finding a route from a start to a target station. Performance measures like error rates or completion times can be recorded and can later be statistically analyzed to confirm or reject and formerly build hypotheses.
More recently, eye tracking has become a cheap technique to also record the eye movements of the study participants in addition to the standard performance measures. The challenge with this data is its spatio-temporal nature that makes an analysis more complicated and demands for more advanced visualization techniques. Two of them are illustrated below. On the left hand side we see a visual attention map, also called heatmap. The right hand side shows two gaze plots for a colored metro map and a grayscale map.
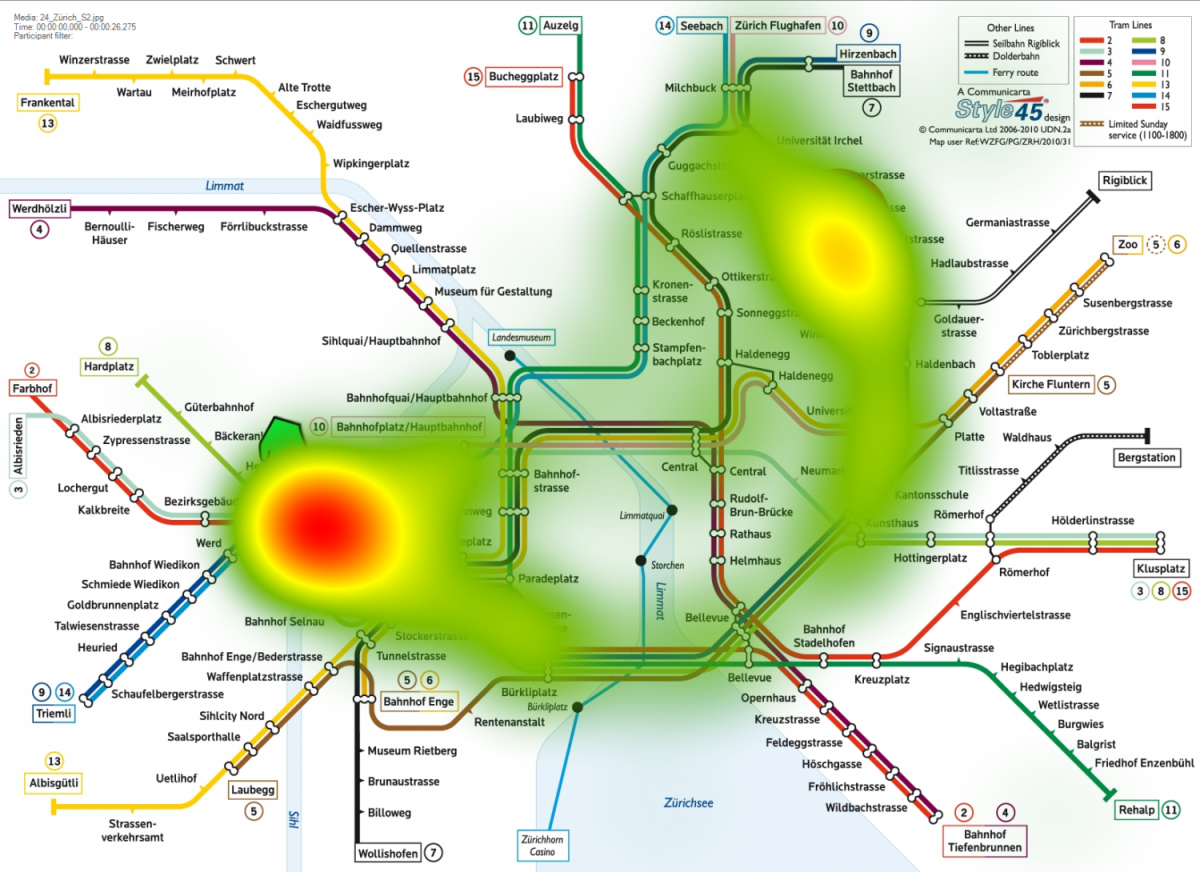
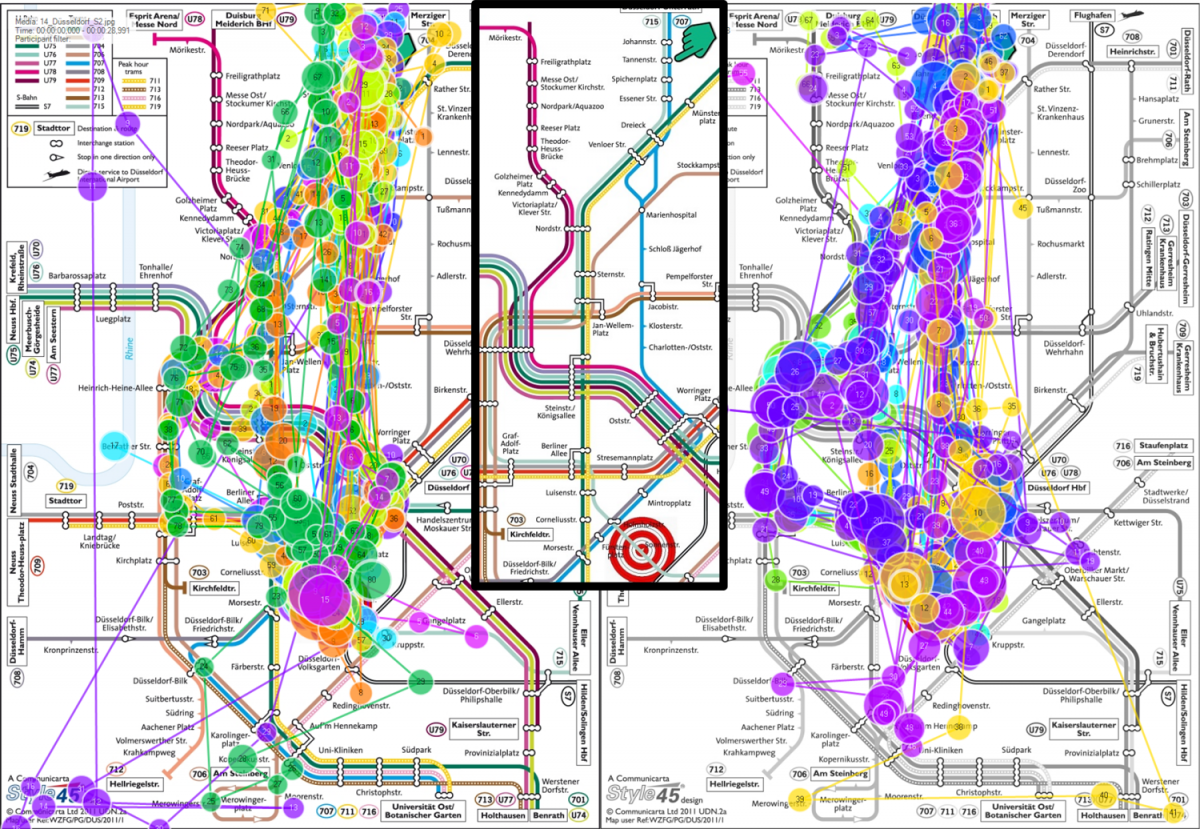
In particular, for the metro maps we evaluated the visual task solution strategies of 40 people inspecting metro maps with color coded metro lines and also in grayscale. The maps with color coding were read differently from those in grayscale, an insight that could only be uncovered by recording the eye movements of the participants. In grayscale maps the fixation durations were much longer while the saccades, i.e., the jumps of the eye from one fixation to the next were very short in average. This contradicts the eye movement strategies in colored metro maps in which the fixation durations are very short, but, on the other hand, the saccades are very long. In general, the route finding task could be answered much faster in colored maps, but with eye tracking we could also find out where this time was actually lost. This shows the benefits and advantages eye tracking can offer.
For future work we plan to design further visualization techniques that can efficiently represent the recorded eye movement data. Moreover, evaluating the impact of adding extra information in metro maps like places of interest or rivers might have, should be explored in more detail. Also the readability of legends in maps is of special interest.