
A panel on inclusive visualization research at IEEE VIS 2025 in Vienna
Visualization research aims to facilitate the understanding of data and the phenomena they characterize. However, does current research in our field ensure this for all users? Are visualizations accessible for all who wish or need to engage with the information? This is what we explored with VisAble, a panel at IEEE VIS 2025 organized by Nina Dörr, Sita Vriend, Katrin Angerbauer and Michael Sedlmair from the University of Stuttgart, and Miriah Meyer from Linköping University.
The panel was organized to discuss different dimensions of accessible and inclusive data visualizations and its research practices. The term “inclusive”, here, was considered in a broader sense: it encompassed accessibility for people with disabilities, but also considered inclusiveness in the sense of accessibility of visualization to the general public and the inclusion of different cultural backgrounds. If aiming for such inclusivity, one is faced with challenging questions regarding the design of visualizations but also regarding the research process itself, such as:
- How do we create inclusive and accessible data visualizations?
- How can we include our target user group in our research?
- What does it mean for visualization research to be inclusive and accessible?
Perspectives from five visualization research experts
Five panelists tackled these questions in discussion rounds: Dominik Moritz, Cindy Xiong Bearfield, Bruce Walker, Kim Marriott and Danielle Albers Szafir. Both Bruce Walker and Kim Marriott focus much of their work on blind and low-vision users. However, Bruce focuses on research with auditory displays, while Kim utilizes tactile displays. Danielle Albers Szafir’s research aims to understand how to develop visualizations for people with Intellectual & Developmental Disabilities (IDD), while Cindy Xiong Bearfield researches perceptual and cognitive factors contributing to visualization comprehension of the general public. Dominik Moritz develops tools and software frameworks that aid developers in identifying barriers in their visualization apps.
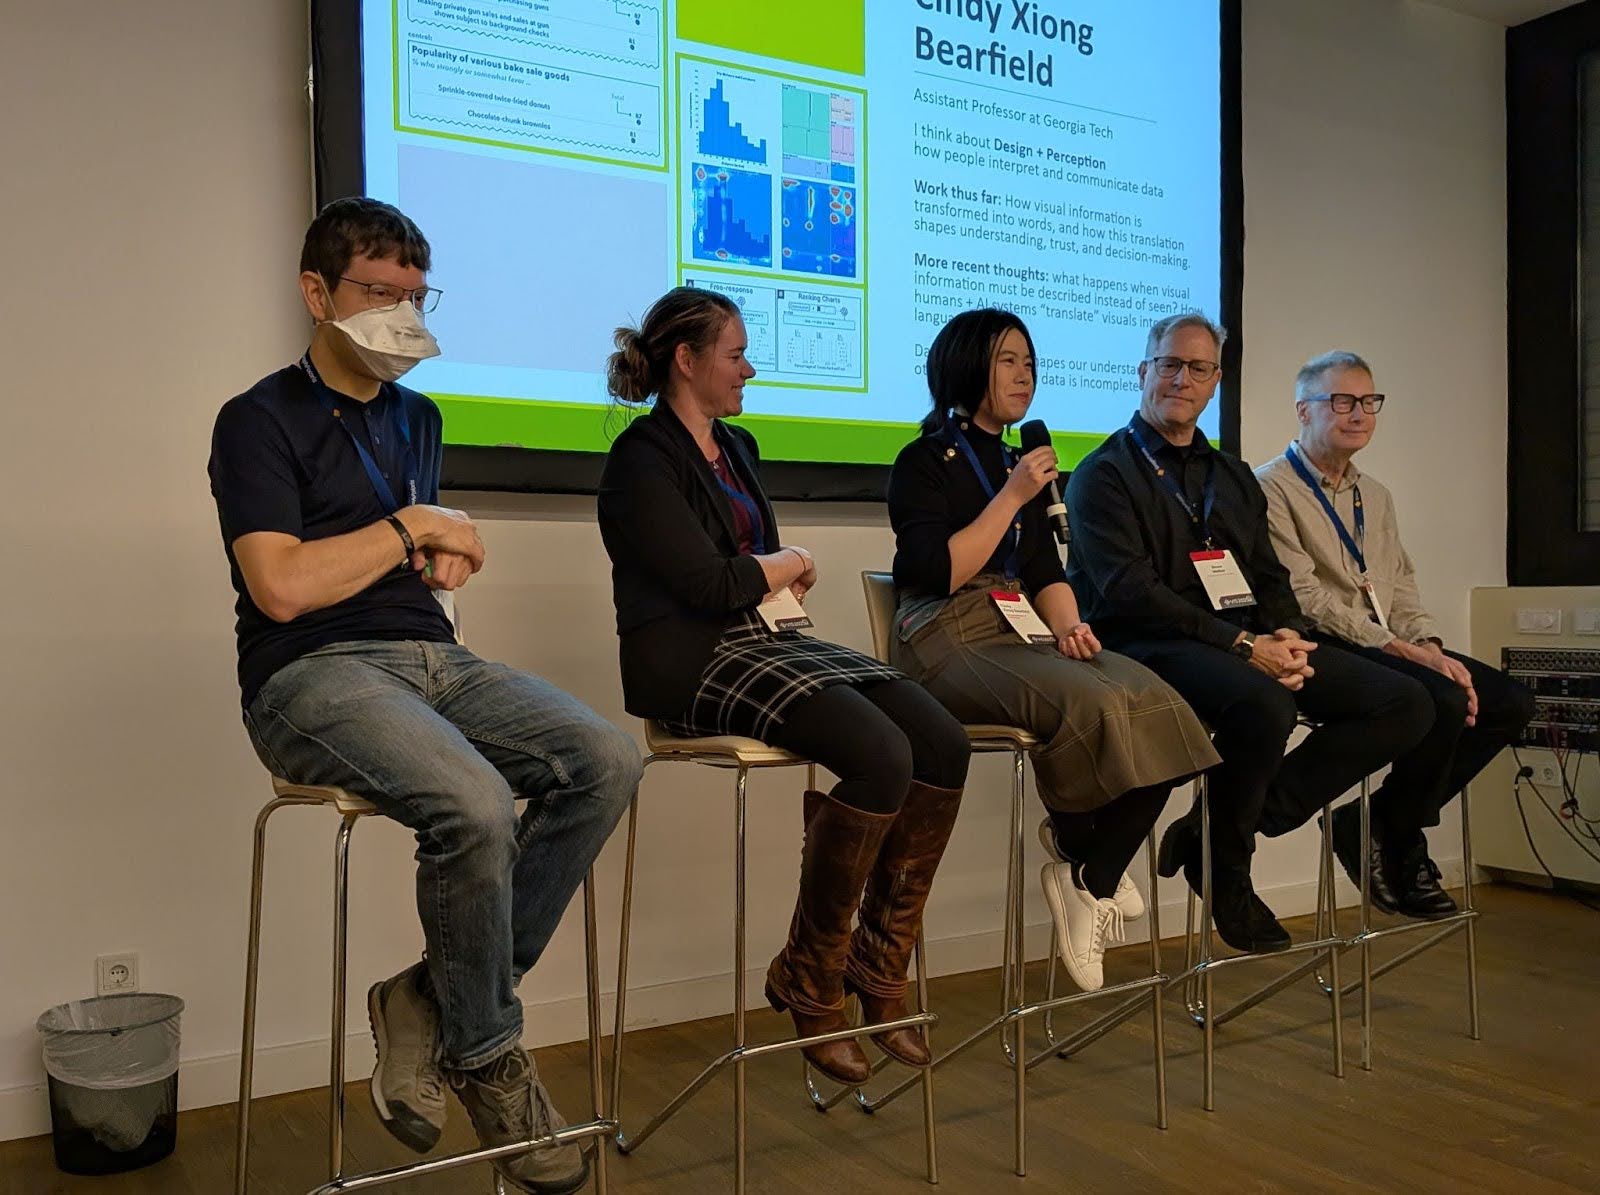
The panelists’ wide variety of expertise enabled multiple perspectives on challenges and fostered interesting and sometimes controversial discussions which were moderated by Sita Vriend.
Target groups, the research process, and individuality of needs
Together with the audience, the panelists thought about the definition of accessibility, target groups, the process of making visualizations more accessible and necessary adaptations to the research process to make it more inclusive. Regarding the research process, Marriott stressed the importance of lived experience and to treat participants not only as a means to an end but as equal co-researchers.
In terms of target audiences, panelists mentioned that visualization research should not forget about people with sensory disabilities, neurodiverse populations and the general public who are not too familiar with data visualizations. According to Szafir, neurodiverse visualization users are still underresearched and she recognizes challenges of inclusion criteria as needs are so diverse. Still, she encourages more research in the area of neurodiversity and visualizations.
In general, the individuality of needs was one of the core challenges discussed and where panelists proposed different strategies. Bearfield stressed the importance of user modeling to ease the load of accessibility testing, while Moritz pointed out the need for more adaptable visualization solutions. Walker emphasized the importance of multimodality and challenged all in the room to think about the definition of visualization: Is it too exclusive by itself?
Lively discussions and a need for more opportunities for exchange
Provocative questions like this kept the discussion lively with high audience participation in the discussion. The event had a great turnout: the room was packed and every seat was taken. The high attendance and active participation were interpreted as hopeful signals by organizers and panelists. There is momentum and interest for the topic of inclusivity and accessibility with its many facets within the VIS community.
As such, the panel was considered a success and the 90 minutes flew by. One panel could not yield comprehensive solutions to complicated questions, of course, but it did provide a platform for thought exchange and sparked further discussions. Though the official time was over, discussions continued in the hallways and during coffee break. The organizers’ takeaway was: We need more panels like this to continue our journey towards inclusive and accessible visualization research!
Our Panelists
Dominik Moritz is an HCI Professor at Carnegie Mellon University and a Machine Learning Researcher at Apple who researches and designs accessible systems for visualization and analysis. https://www.domoritz.de/
Cindy Xiong Bearfield is an Assistant Professor at the School of Interactive Computing at Georgia Tech who researches how data is interpreted in order to understand how data visualization can be more accessible. https://cyxiong.com/
Bruce Walker is a Professor of Psychology and Interactive Computing at Georgia Tech. He and his lab research human-computer interaction in non-traditional, multi-sensory interfaces, and psychological and social factors in the adoption and use of technology. http://sonify.psych.gatech.edu/~walkerb/
Kim Marriott is a Professor at Monash University and heads the Monash Assistive Technology and Society (MATS) Center. His research focuses on how new technologies such as mixed reality, AI, refreshable tactile displays, and 3D printing can be used to present graphical content and environmental information to people who are blind or have low vision. https://research.monash.edu/en/persons/kimbal-marriott
Danielle Albers Szafir is an Associate Professor at the University of North Carolina at Chapel Hill where she researches the relationship between cognition and visualization design and aims to understand how visualization design allows people to learn from and interact with data. https://danielleszafir.com/