
I’m happy to share that I’ve successfully defended my Ph.D. thesis with the title “Visual Analytics of Spatial Events: Methods for the Interactive Analysis of Spatio-Temporal Data Abstractions”.
Technological advances, especially in remote sensing, GPS sensors, and computer vision and camera-based tracking, now allow for a collection of spatio-temporal data on an unprecedented scale. These massive datasets raise the problem of how subject matter experts can derive useful knowledge from them and how these datasets can be visualized without leading to overcrowded and cluttered displays. For that, suitable data abstractions are required on the one hand and the integration of subject matter experts in the analysis process instead of solely relying on automatic methods on the other hand.
My dissertation addresses both of the aforementioned problems two-fold: First, spatial events, which are objects with a limited temporal existence with an additional associated spatial position, are identified as a suitable data abstraction for visualization and further analysis. Additionally, complex spatial events are introduced, which occur in domains where events not only have a spatial and temporal location, but where the events can have semantic interrelationships, have interdependencies with other objects on other objects, or are constricted by outside rules and influences. Finally, Visual analytics is employed to ensure the integration of subject matter experts in the analysis process of (complex) spatial events via a combination of automatic and visual analysis methods with a tight coupling through human interaction.
The suitability of visual analytics to analyze spatial events is successfully demonstrated in a diverse range of domains and the current state of the art is broadened by several contributions:
- Via traditional methods such as glyph-based map representations that are extended to enable the subject matter experts to use their insights from the visualizations to steer the model building process further.
- With completely newly developed methods such as query-by-sketch interfaces based on real-world metaphors that offer model visualizations that enable the subject matter experts to evaluate findings of the underlying models.
- Furthermore, new approaches are presented that enable the users to offload the complexity of defining complex spatial events and query construction unto the system with the help of visual query languages.
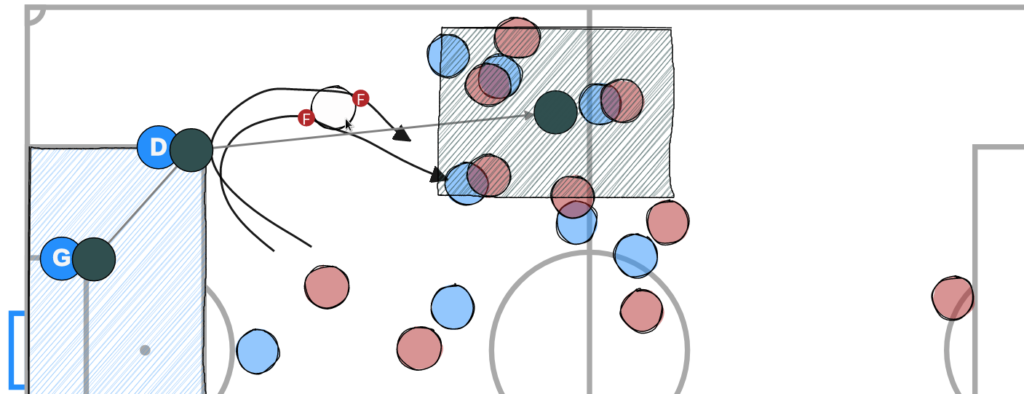
Our visual query interface is based on the real-world metaphor of a magnetic tactic board, widely used in practice for team coaching and analysis in team sports including soccer. Users efficiently and effectively specify team situations by dragging & dropping magnets representing players, such as Goalkeeper or Defender, or the ball to pitch positions and simplified sketch interactions. The above example shows two aggregated slow build-up play situations retrieved with our approach. Aggressive playing behavior of the Forward to immediately pressure the defender is clearly visible in both.
You can find my thesis in KOPS: http://nbn-resolving.de/urn:nbn:de:bsz:352-2-2vs55lce7cin0