I am pleased to report that I have successfully defended my doctoral thesis titled “Performance Quantification of Visualization Systems”.
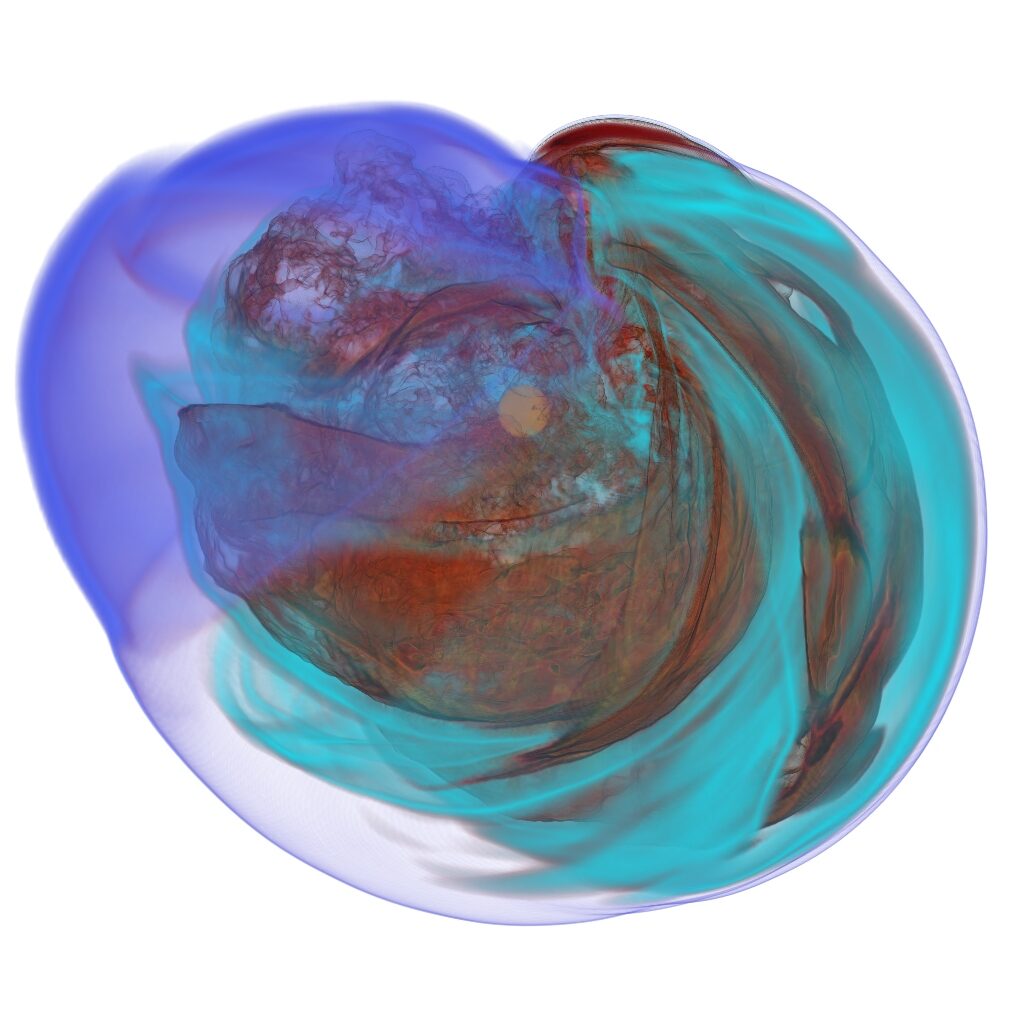
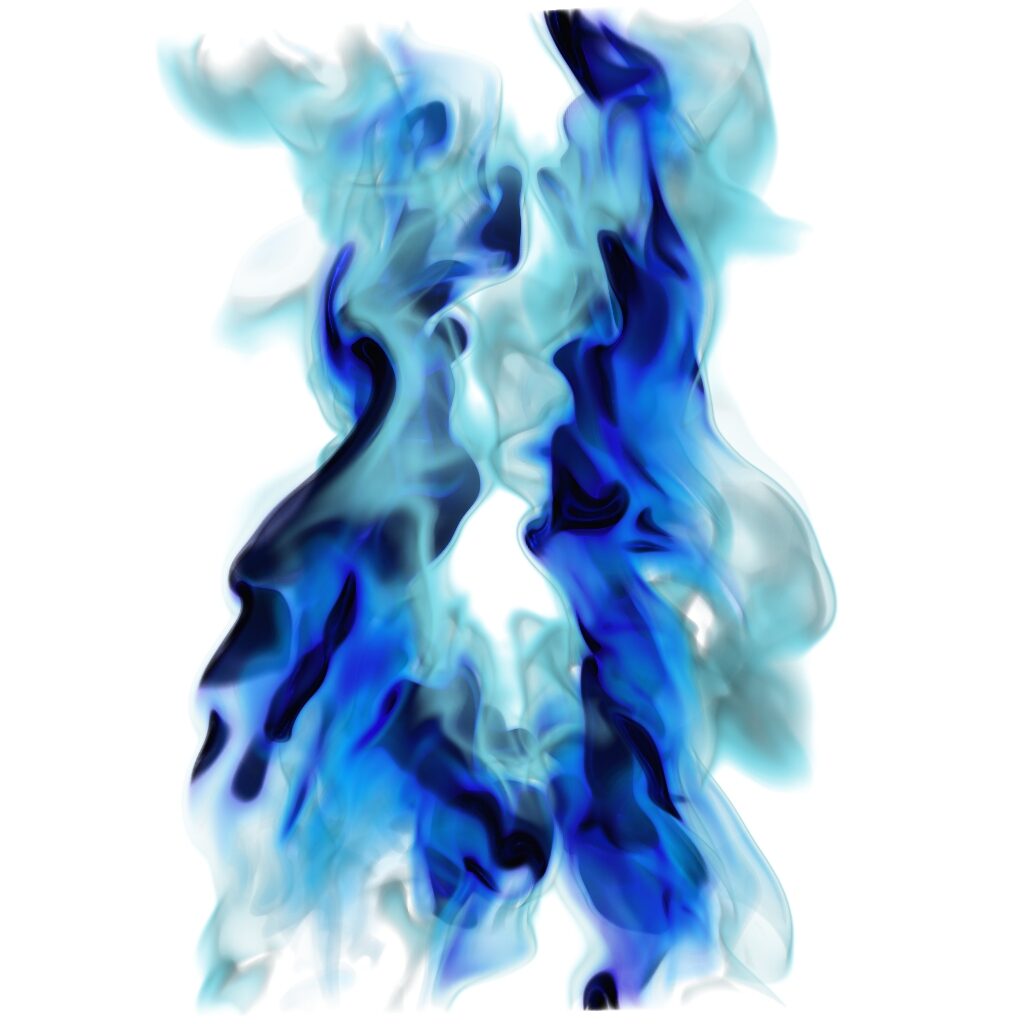
In this work, we mainly investigated the runtime performance of visualization systems, that means visualization application that run on a specific compute architecture or device. This device can be everything from a mobile or embedded device, a regular workstation equipped with one or multiple graphics cards, up to a leading-edge supercomputer featuring hundreds of nodes. In terms of applications, I mainly focused on volume rendering from simulation or scan data, but also rendering volumetric representations from abstract data.
Major motivations of this research are user experience—a fluent interaction for explorative visualization applications is crucial for a satisfying user experience—and cost savings.
Reducing the runtime of visualization algorithms can save costs in general but is is particular interesting on supercomputers, where compute time is in high demand.
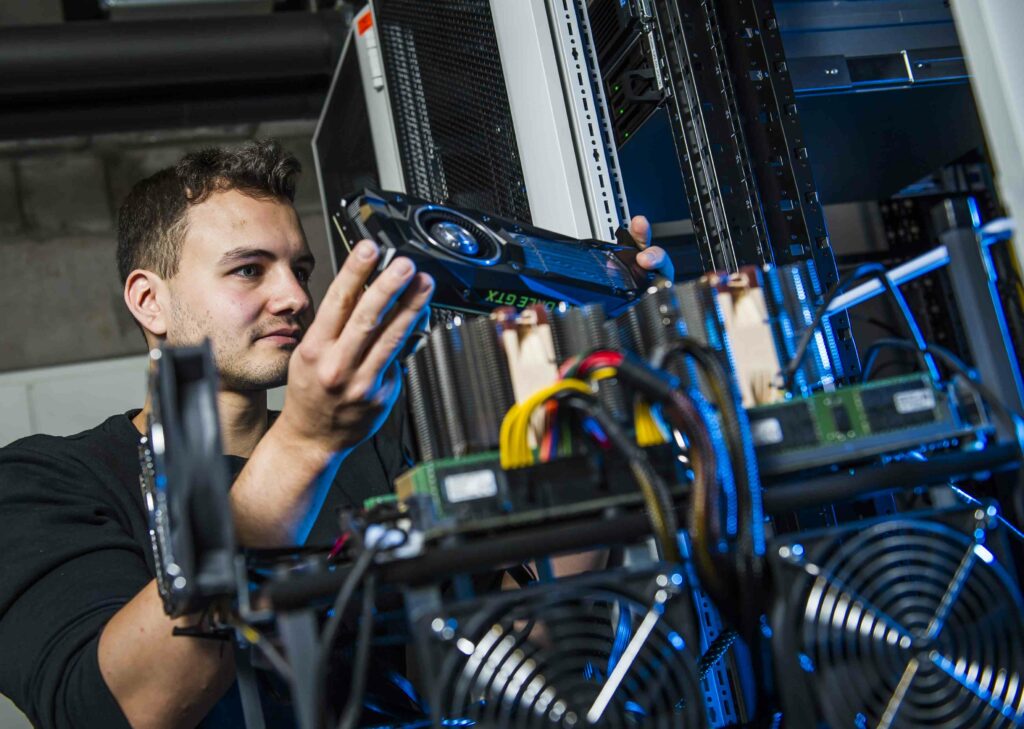
The main challenges included the large parameter space, i.e. the many factors that influence performance, such as data set, hardware or rendering parameters; but also the diversity in hardware. Visualization algorithms typically run in parallel, using graphics cards or distributed systems.
During this thesis, we analyzed and advanced the state of performance evaluation for scientific visualization. We developed novel models for volume rendering in different scenarios: real-time performance prediction to tune parameters during exploration, prediction-based load balancing on supercomputers and multi-GPU systems, and several more, e.g., to adapt encoding quality or estimate performance gains for hardware upgrade scenarios.
Finally, we applied performance optimization to volume rendering, such as foveated rendering by exploiting properties of the human visual system. Those performance improvement made it possible to use volume rendering—a technique that is typically very compute intensive—for the visualization of other data types such as dynamic graphs or the combination of eye-tracking, video and optical flow data.
Fortunately, I had the opportunity to collaborate and work with some very smart and talented people in the field of visualization. Without them, this work would not have been possible. I thank all these people and everyone else who supported me over the course of this PhD. Special thanks to my supervisor Thomas Ertl, my mentor Steffen Frey and Hank Childs who hosted me during my stay abroad in Oregon. Finally, I thank the DFG for funding this research within the project A02 of the SFB-TRR 161.